Investor Presentation
1doc Evidence Graph
From Data Storage to Clinical Intelligence
1doc Health Group
Scene 01
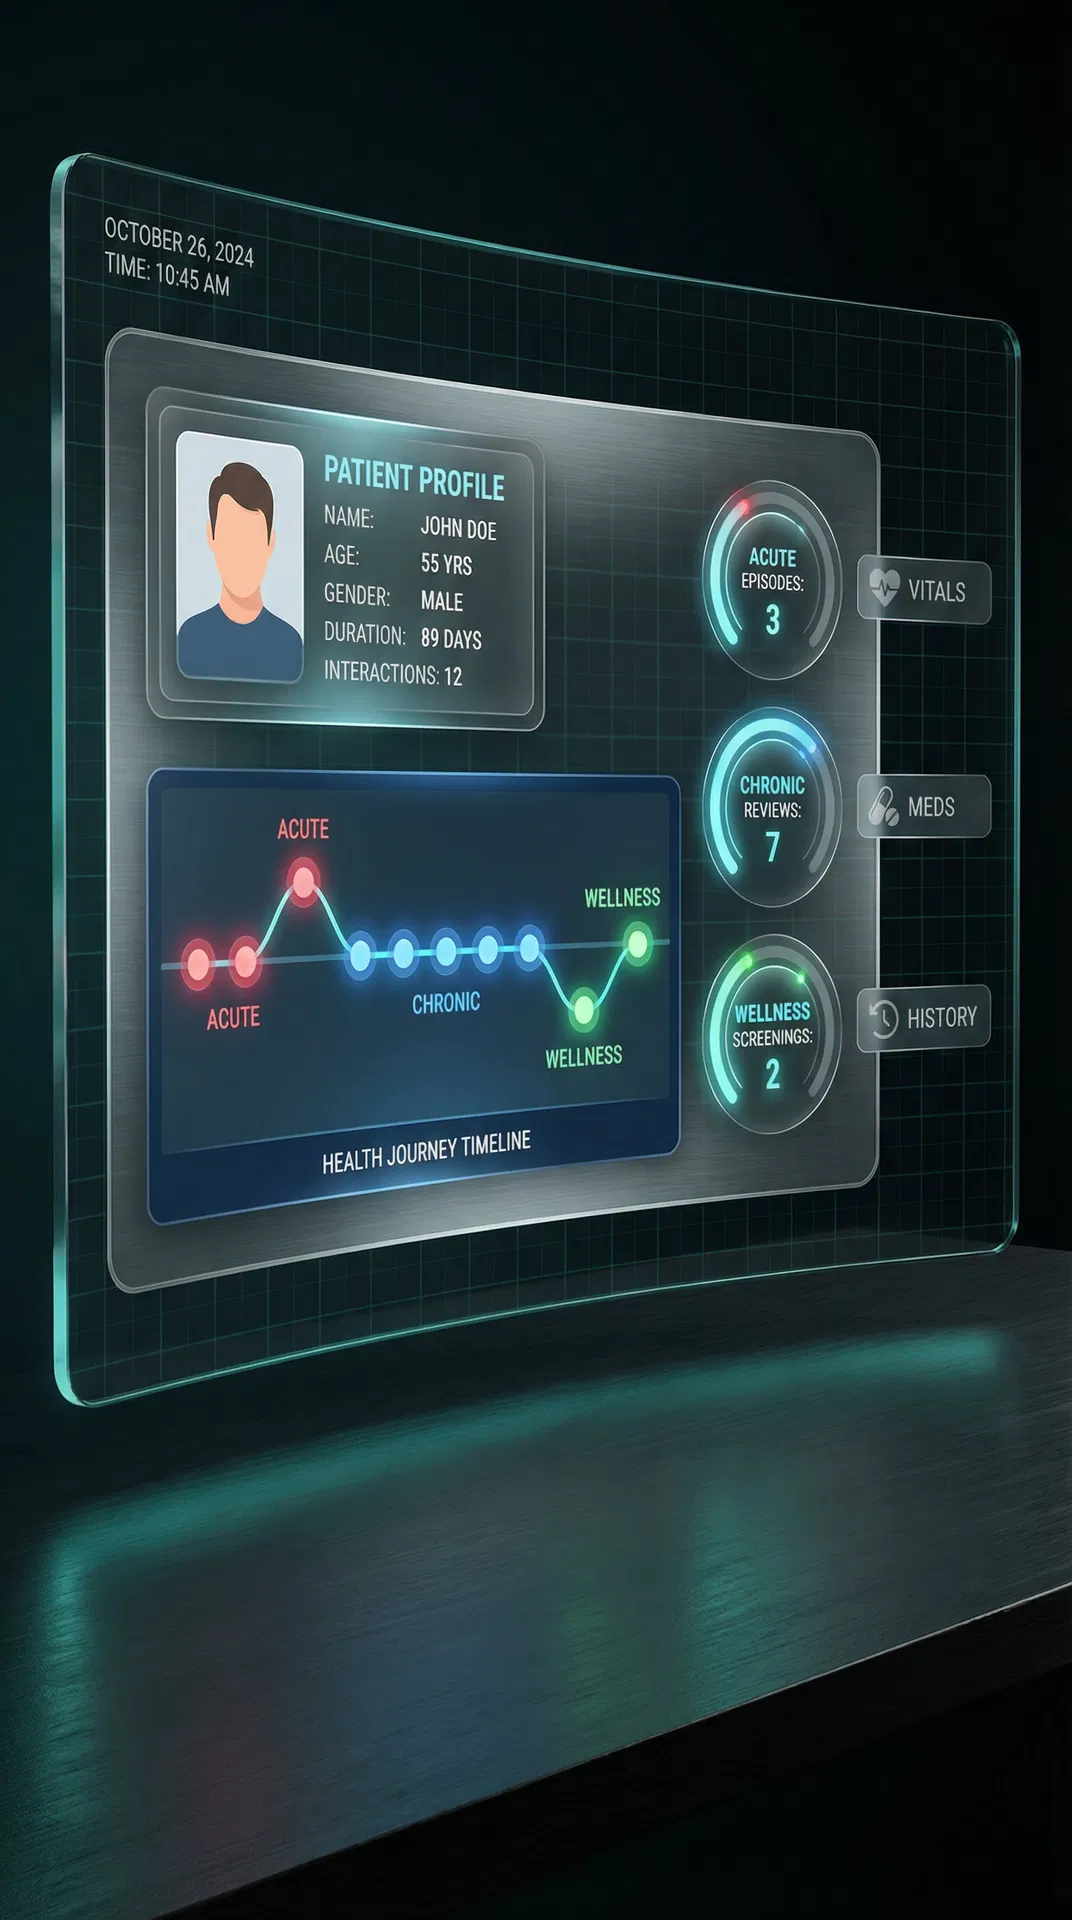
A Health Journey, Not a File
A unified living picture of a patient's health across two years. 12 interactions, structured, coded, and queryable. Not a list of dates — a journey.
Scene 02
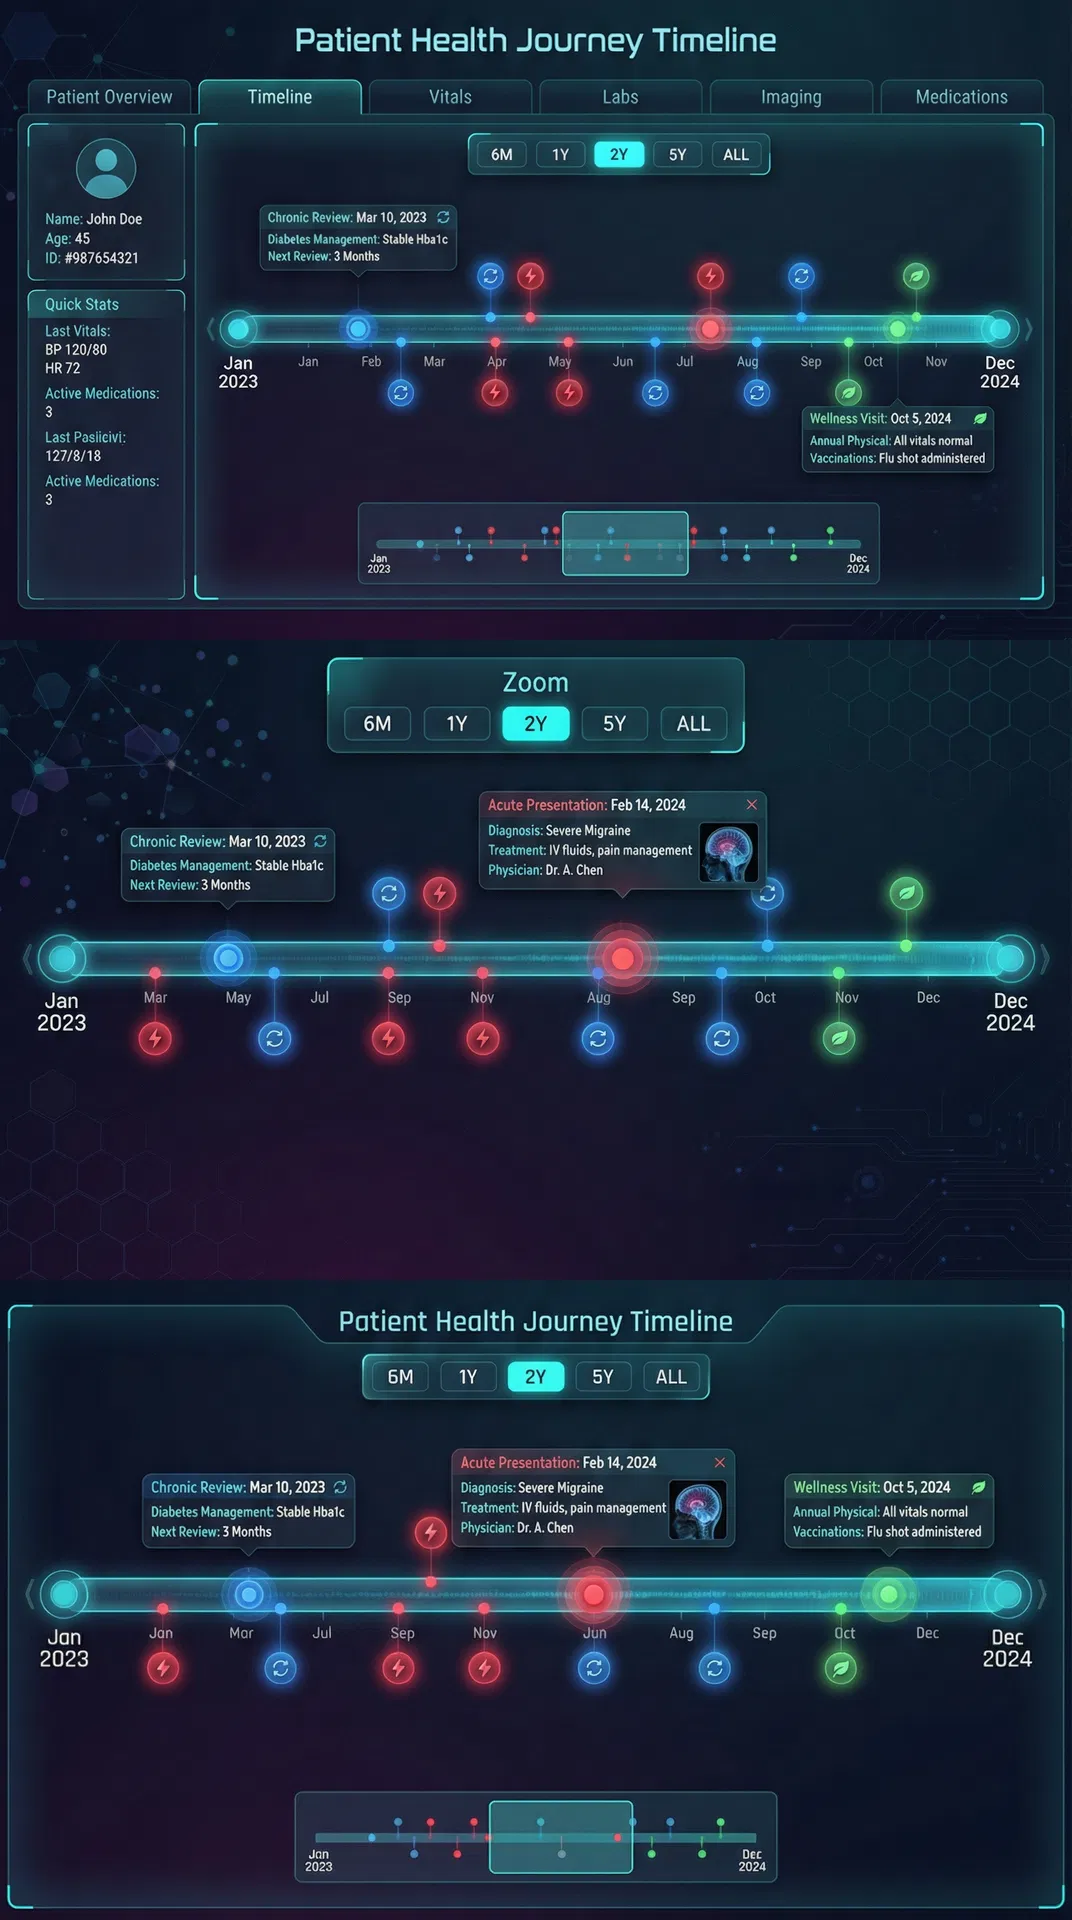
Interactive Timeline
Zoomable from 6 months to full history. Every visit plotted, colour-coded, and clickable. The trajectory over time — not just the last visit.
Scene 03
Acute Pattern Analysis
The engine doesn't just show visit history — it runs pattern analysis. It compares against matched cohorts and surfaces actionable insights automatically.
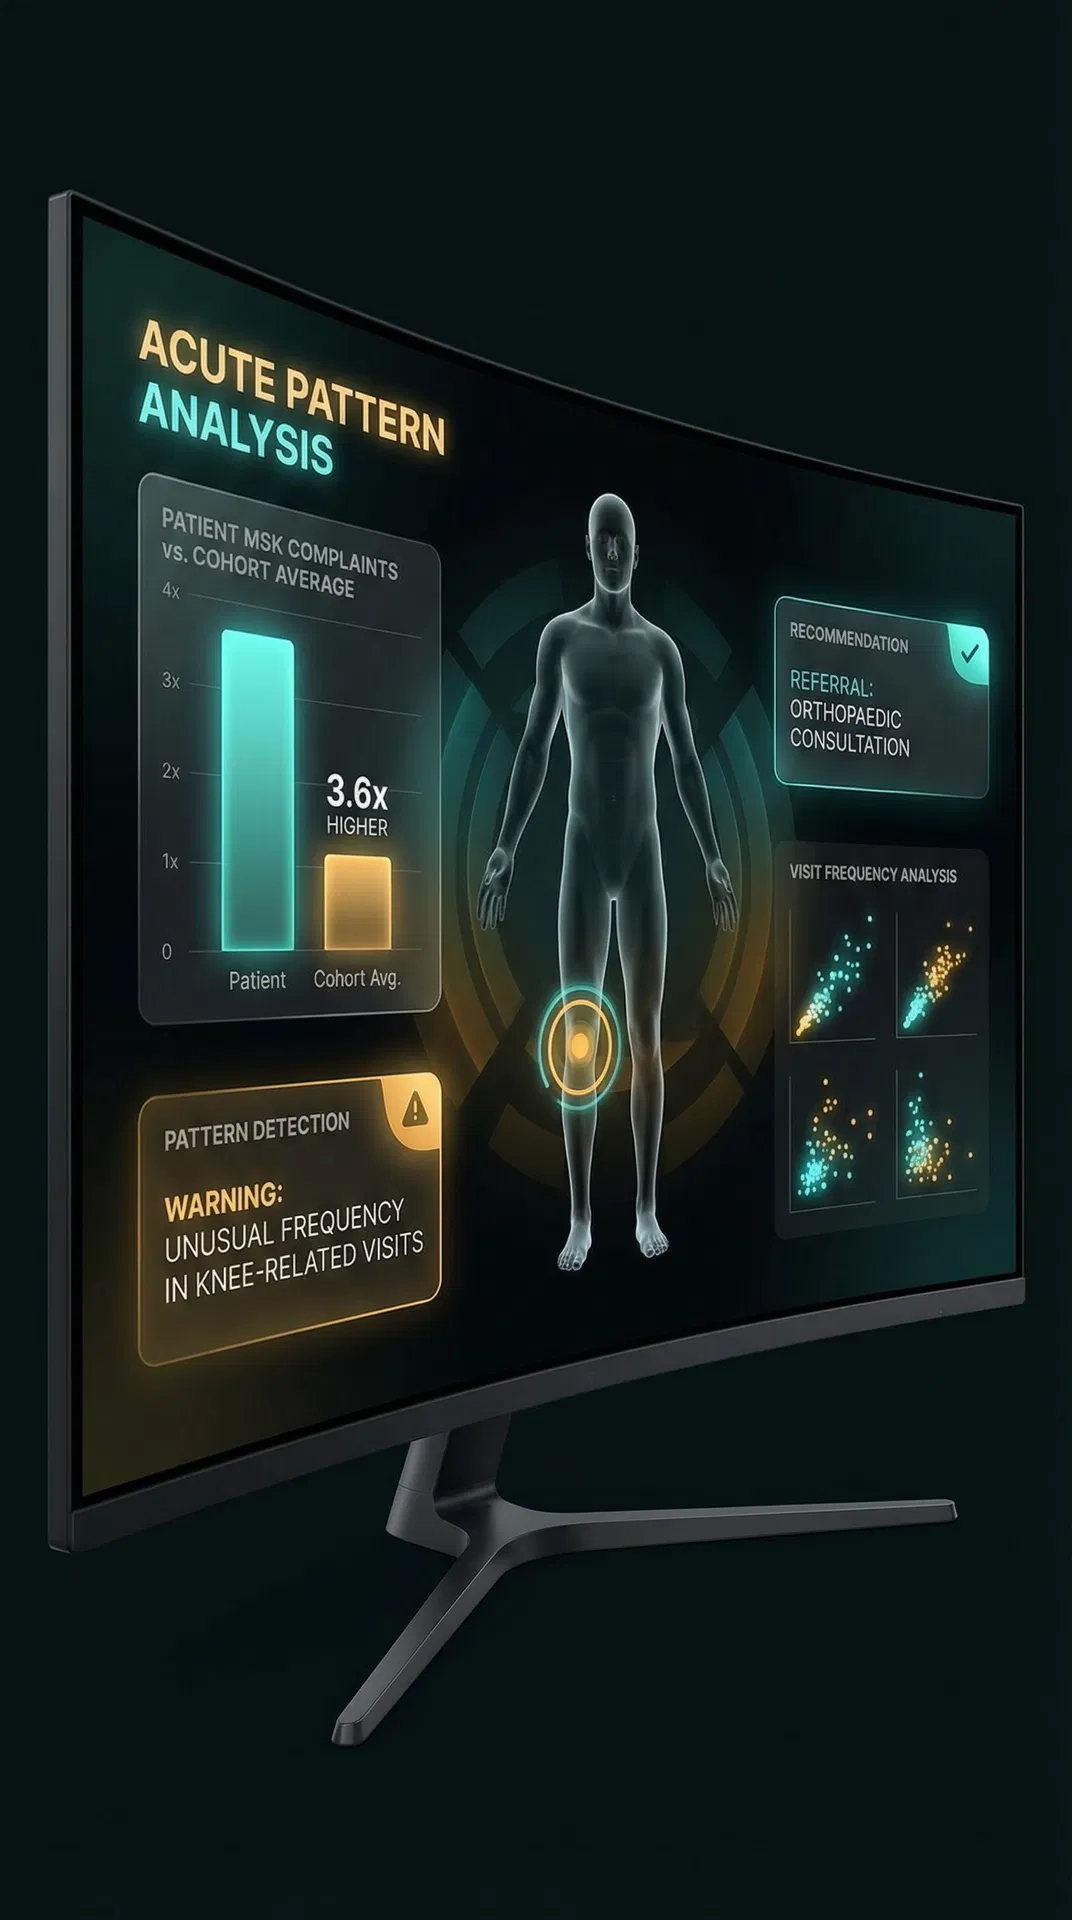
3.6x Higher MSK Risk
Compared against matched cohort (males 50-60, same ethnicity). Three acute presentations — all musculoskeletal, two to the right knee. Flagged automatically.
REACTIVE MEDICINE → PREDICTIVE MEDICINE
Scene 04
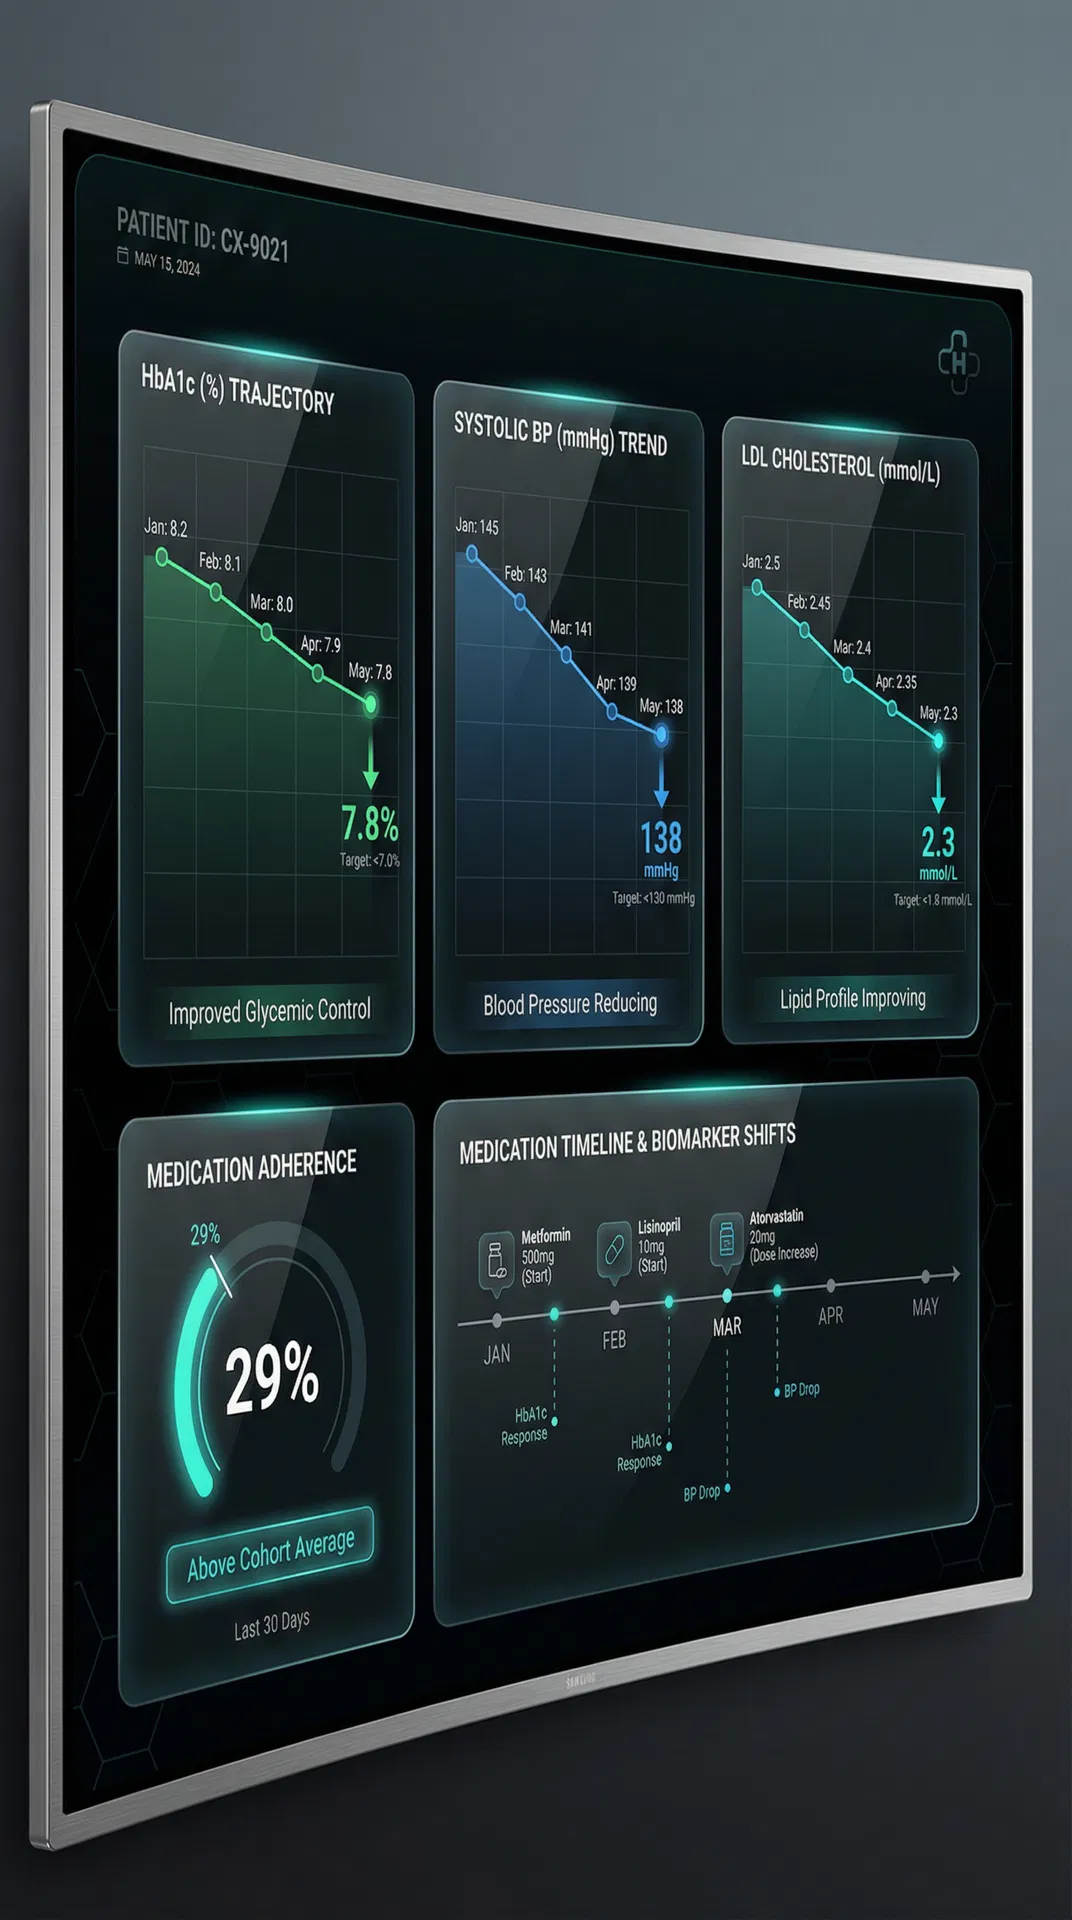
Chronic Disease Trajectory
Three chronic conditions tracked over time. Proof of intervention effectiveness — not just numbers, but the story of what's working.
Scene 05
Wellness & Preventive Care
Where most health systems have nothing at all. Vaccinations, screenings, exams — flagged automatically. Not by hiring more staff, but by building intelligence into the infrastructure.
EPISODIC REACTIVE CARE → CONTINUOUS PREVENTIVE MEDICINE
Scene 06
AI Insight Engine
Patient-specific, data-driven insights generated from two years of structured longitudinal data. Not generic health tips.

Acute Visit Rate -40%
After chronic disease management programme began
54-Day Visit Pattern
Next acute presentation predicted: late March
Recommendation Generated
Book diabetic retinopathy screening now — HbA1c trajectory favourable
Scene 07
The Cost Picture
Healthcare spend per patient, segmented by care type, benchmarked against matched cohort averages. Prevention is not just better medicine — it is a better cost structure.
Reasonable for care complexity
Below average — CDM keeping patient out of acute
Active management investment
Above average — proactive approach
Prevention = Better Cost Structure
Effective CDM reduces acute presentations, lowering overall healthcare spend per patient
Competitors are building better filing cabinets.
1doc built a clinical intelligence engine.
A real-world, continuously learning evidence base that makes every clinical decision smarter than the one before it.
1doc Health Group · Confidential